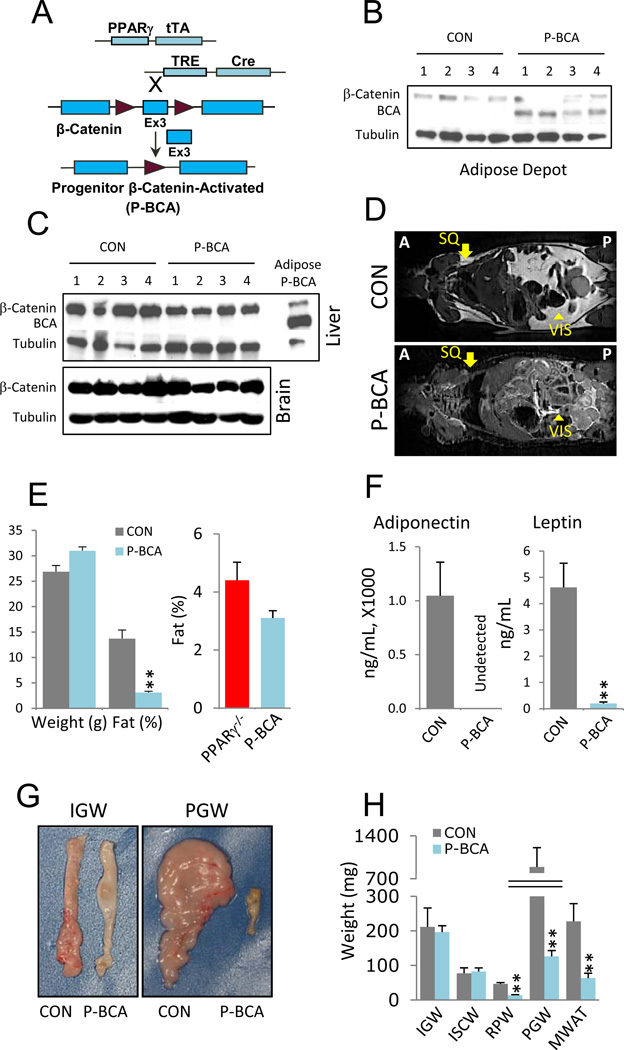
Figure 2. β-catenin Activation in Adipose Progenitors Reduces Adiposity.
(A) Schematic of progenitor cell-autonomous activation of β-catenin (P-BCA) using a tet transactivator (tTA) knocked-into exon 2 of the PPARγ locus. In PPARγ positive cells, tTA is translated and binds to a transgenic tet-response element (TRE), inducing Cre expression and β-catenin activation. Maroon arrowheads represent LoxP sites.
(B, C) Westerns of control (CON) and P-BCA inguinal adipose depots (B) or livers and brains (C) assayed with anti-β-catenin and anti-tubulin antibodies. β-catenin indicates wild-type form; BCA indicates activated form. Tubulin serves as loading control. In C, P-BCA adipose depot extracts are a BCA positive control.
(D) MRI scans of control and P-BCA siblings. Arrows indicate normal location of subcutaneous (SQ) adipose depots; arrowheads indicate visceral (VIS) adipose depots. Anterior (A); Posterior (P).
(E) Left plots show weight and percent body fat (NMR spectroscopy), of control and P-BCA siblings. Right plot is percent body fat of PPARγ nulls (PPARγ−/−) and P-BCA mutants.
(F) Adiponectin and leptin levels of control and P-BCA sibling sera.
(G) Representative inguinal (IGW) and perigonadal (PGW) WAT explants of control and P-BCA siblings.
(H) Weights of various adipose depots, as in Figure 1G, of control and P-BCA siblings.
Representative studies on 4-month old sibling males; n ≥ 8 per cohort, repeated ≥ 3 cohorts. Female data mirrored these effects elicited by the P-BCA mutation. Error bars indicate SEM. Statistical significance assessed by two-tailed Student’s t-test, **p<0.01.

