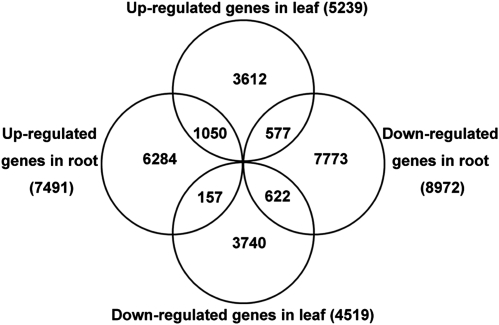
Figure 5.
Number of DEGs in the root and the leaf of M. pinnata. The numbers of DEGs that were exclusively up- or down-regulated in one tissue are shown in each circle. The numbers of DEGs with a common or opposite tendency of expression changes between the two tissues are shown in the overlapping regions. The total numbers of up- or down-regulated genes in each tissue are shown outside the circles.

