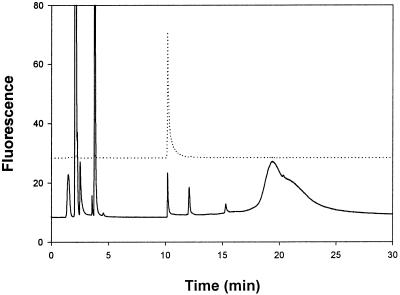
Figure 2.
Separation of ABD-T by reversed-phase HPLC. Samples were treated with acetonitrile and then derivatized with ABD-F in the presence of TCEP and EDTA as described in Materials and Methods. Chromatography was performed with a Hypersil C4 column. Mobile phase: A, 5 mM Tris⋅HCl, pH 7.5; B, 50% 2-propanol in A. Flow rate: 1 ml/min. The column was washed with 100% A for 2 min, followed by a linear gradient from 0 to 75% B for 15 min and another wash with 75% B. Excitation and emission wavelengths were 384 nm and 510 nm, respectively. The fluorescence detector gain was set at ×100 scale expansion. Injection volume was 50 μl. The dotted line is the chromatogram of the ABD-F derivative of purified MT (23 pmol). The solid line is the chromatogram of the derivatized rat liver sample (2 mg total protein).

