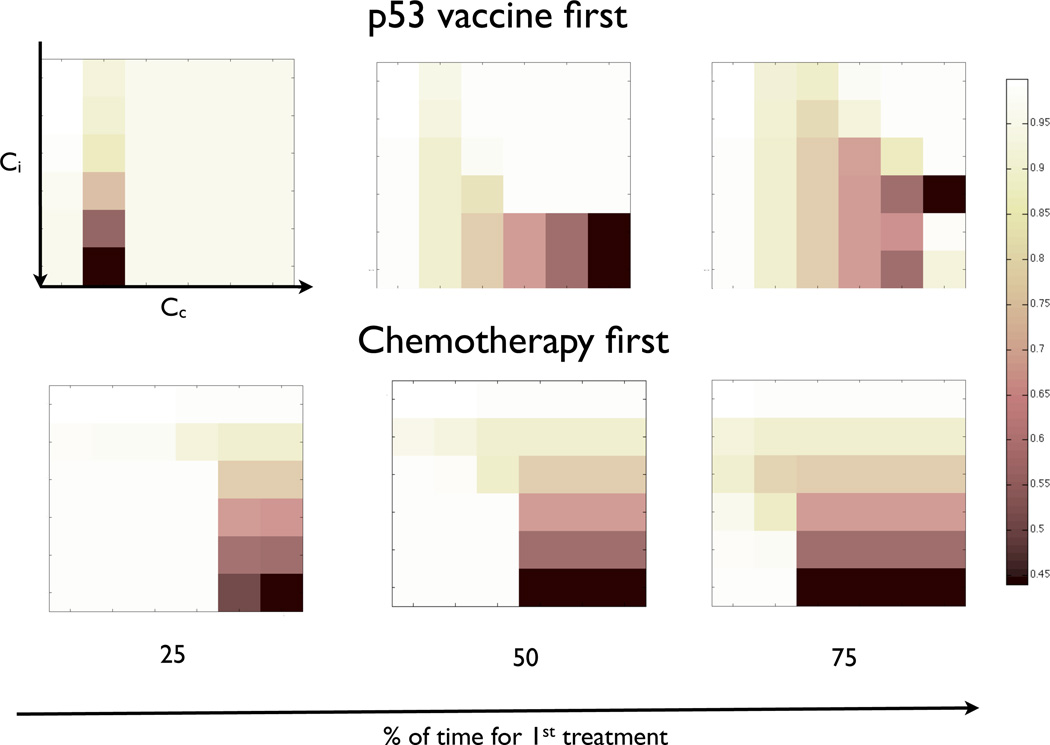
Fig. 1.3.
Average tumour fitness at the end of the simulations. The following plots show the average tumour fitness (where darker shades represent less fitness) after 1 00 time steps in which the order, dosage and timing of the application of the two treatments is changed. The first row shows the scenarios in which the p53 vaccine is applied first whereas the second row shows the results when chemotherapy is applied first. Each column shows the effect of spending 25, 50 and 75 time steps on the first therapy (using the remain time steps for the second). Each of the grids represents the average tumour fitness after using treatments with an intensity varying between 0 and 0.5. As an example, the box in the top left corner shows the average tumour fitness in a number of scenarios that share the fact that the p53 vaccine is applied first for 25 time steps followed by chemotherapy for 75 time steps. In this particular case the results show that increasing the cost of being susceptible to the p53 vaccine (Ci) has a higher impact to the tumour fitness than increasing the cost of being susceptible to chemotherapy (Cc)

