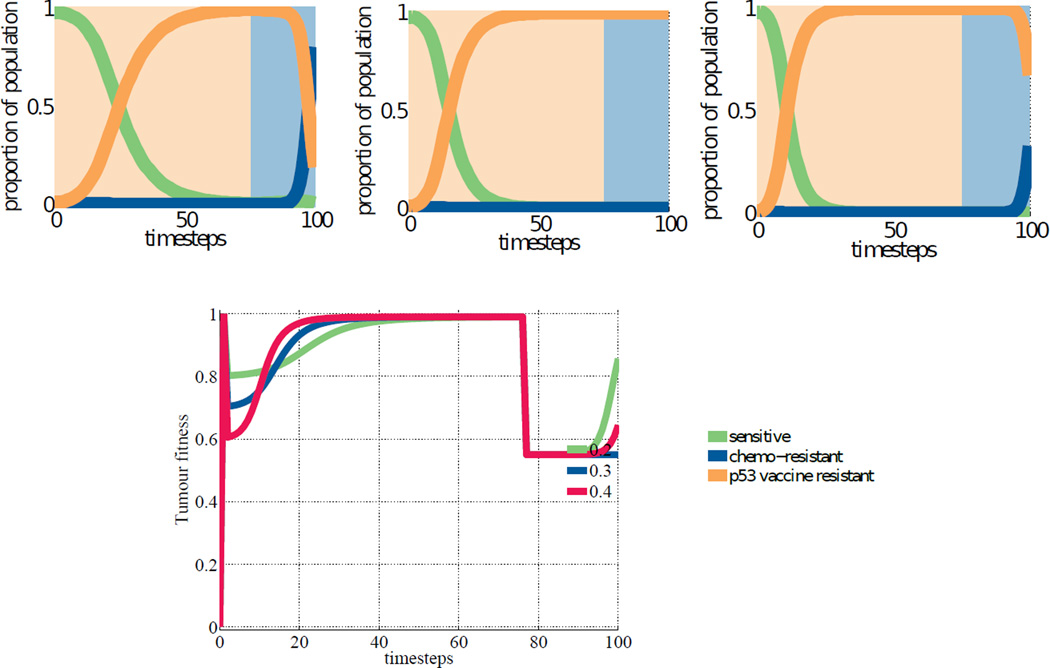
Fig. 1.4.
Three simulations where the p53 vaccine is applied first using three different penalties for cells susceptible to the p53 vaccine Left 0.2. Application of the p53 vaccine results in a strong selection force for tumour cells that are resistant to the vaccine. After 75 time steps the application of chemotherapy results in a strong growth for the chemotherapy resistant population which was never entirely eradicated. Centre 0.3. As it was the case before, the first 75 time steps result in selection of p53 vaccine resistant cells but in this case the chemotherapy resistant population has been decimated to the extent that is unable to show any noticeable recovery when chemotherapy is applied. The original population susceptible to the two treatments, although not entirely eradicated, is unable to play a role. Right 0.4. As it was the case previously, after the 75 time steps of p53 vaccine chemotherapy is applied. In this case the original susceptible population is entirely eradicated whereas the one that is resistant to chemotherapy, although comparatively very small, manages to survive until the application of chemotherapy results in a strong selection force for this cell type. Bottom The average tumour fitness under the three different scenarios.

