
Figure 6.
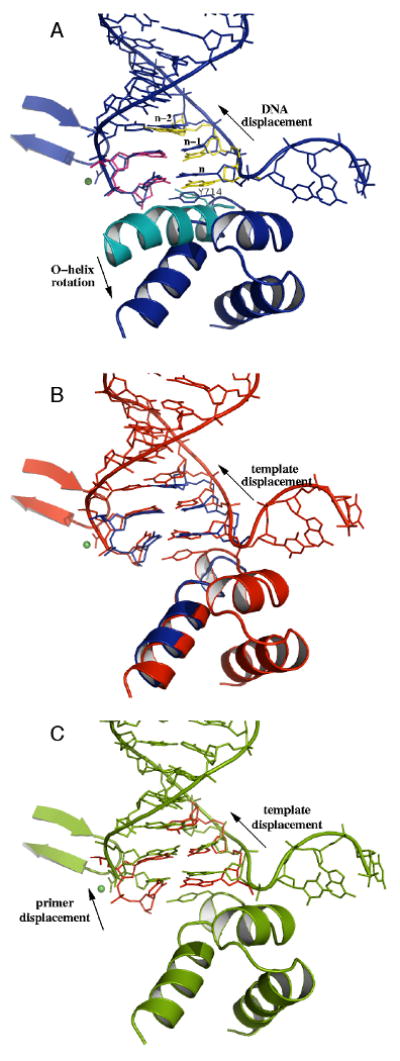
Comparison of metastable states A, B, C (corresponding to labeled circles in Figure 5); each panel compares two structures. A: Metastable state A (dark blue) compared with starting configuration (protein in teal blue, primer bases in yellow, template bases in purple) rotation of the O-helix and the displacement of n-template and n-1 template bases. B: Metastable states B (red) vs. A (dark blue), displacement of n-1 template and further downstream bases. C: C (green) vs. B (red), displacement of the n-primer base. (θ, δ, β)A = (63, −4.6, 13); (θ, δ, β)B = (70, −3.3, 13); (θ, δ, β)C = (68, −1.9, 14). Notice the distortion of the DNA template strand between the n-template and the preinsertion bases. Phosphate backbone is represented by tubes. Protein is shown as ribbons. Mg2+ ion is shown as green sphere. The DNA positions of the open configuration can be inferred from the closed configuration and are not shown here.