
Figure 7.
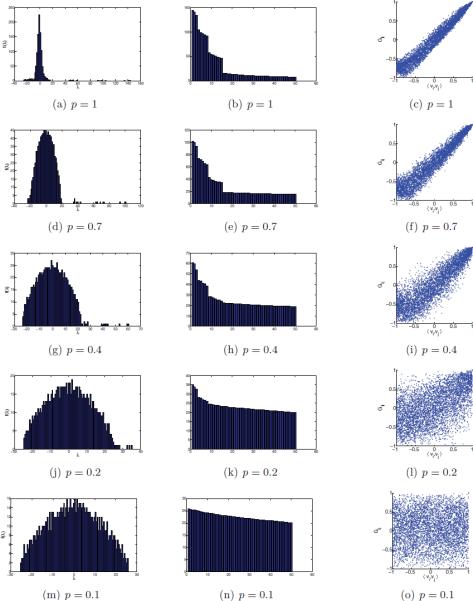
n = 1000, α = 45.6° , and different values of p . Left column: histogram of the eigenvalues of H . Middle column: bar plot of the top 50 eigenvalues of H . Right column: scatter plot of Gij as estimated in step 6 of the algorithm (y-axis) against the dot product of the true simulated viewing angles 〈vi, vj〉 (x-axis).