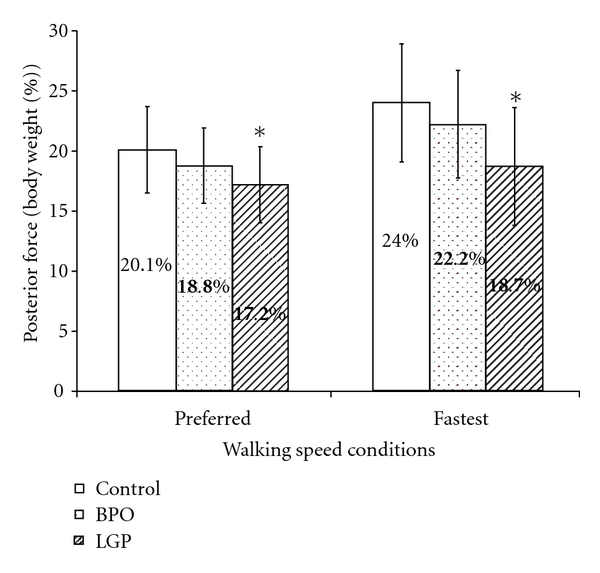
Figure 4.

Comparison of peak posterior force (% of body weight). *When gait velocity was controlled as a covariate, the peak posterior force was significantly less in the LGP group compared to the control group during both the preferred walking speed condition and (P = 0.013) and the fastest walking speed condition (P = 0.002). There was no significant difference in peak posterior force between BPO and control groups during the preferred (P = 0.219) and fastest walking speed conditions (P = 0.210).
