
Figure 5.
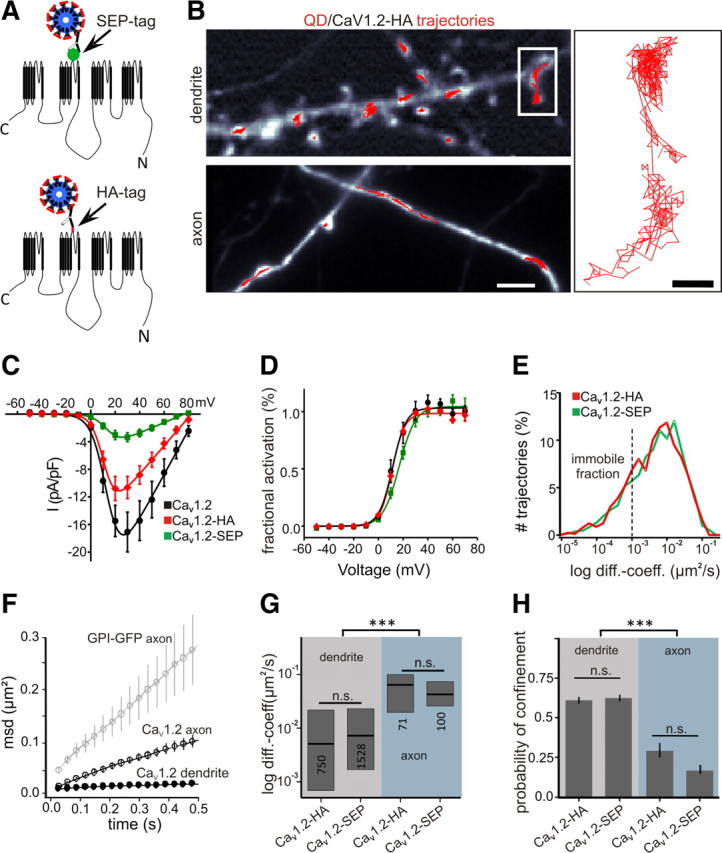
Single particle tracking of CaV1.2 in the cell surface of dendrites and axons of hippocampal neurons. A, Membrane topology of CaV1.2 channels showing the position of the SEP-tag and HA-tag used for labeling with quantum dots. B, Fluorescence images of a dendrite and an axon of a CaV1.2-HA and Homer1C-DsRed-cotransfected neuron (grayscale image) with superimposed trajectories of individual QD-labeled CaV1.2-HA channels (red). Scale bar, 5 μm. Magnified trajectories (right) show that during the 60 s recording time, CaV1.2-HA is transiently confined in dendrites during periods of free diffusion. Scale bar, 1 μm. C, D, Comparison of current–voltage curves and voltage dependences of activation of untagged, HA-, and SEP-tagged CaV1.2 (black, red, green lines, respectively) expressed and recorded in dysgenic myotubes (mean ± SEM). E, Distribution curves of the instantaneous diffusion coefficients of the SEP- and HA-tagged constructs are identical (mean ± SEM). F, The mean square displacement curves indicate strongly confined movement in dendrites and diffusive movement of CaV1.2-SEP in axons; for comparison, note the MSD curve of the freely diffusive GPI-GFP in the axon. G, The diffusion coefficients for both constructs are an order of magnitude lower in dendrites than axons (HA-tagdendritic = 0.005 μm2 s−1 IQR 0.0007/0.02; SEP-tagdendritic = 0.007 μm2 s−1 IQR 0.002/0.02; HA-tagaxonal = 0.04 μm2 s−1 IQR 0.02/0.07; SEP-tagaxonal = 0.06 μm2 s−1 IQR 0.02/0.1; Kruskal–Wallis test, followed by a Dunn's test, p < 0.0001). H, The probability of confinement is significantly higher in dendrites than in axons (one-way ANOVA followed by a Newman–Keuls test, p < 0.0001).