
Figure 4.
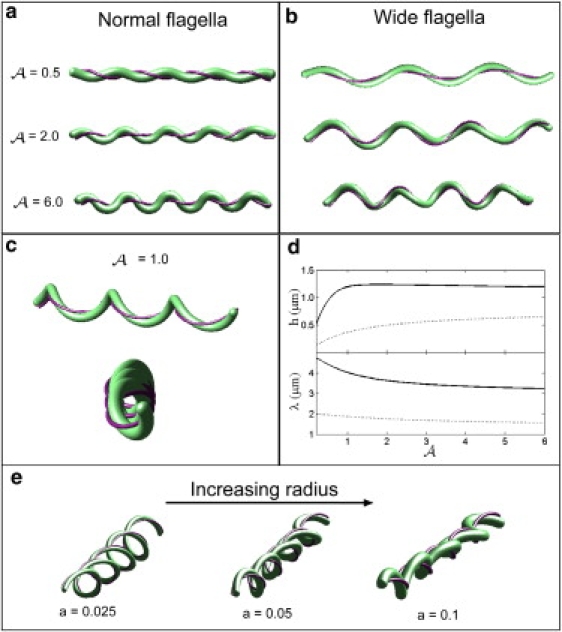
Predictions of the mathematical model. (a) The shape of the cell when the flagella are deformed with respect to the normal form for A = 0.5, 2, and 6. Increasing the stiffness of the periplasmic flagella leads to larger deformations of the cell cylinder. When A is between 1 and 5, the flat-wave shape precesses about the long axis of the cell morphology, which leads to a nonplanar waveform (bottom figure). (b) The shape of the cell when the flagella are deformed with respect to the wide form for A = 0.5, 2, and 6. (c) For the larger waveform of the periplasmic flagella, the morphology is not a true flat wave, but rather is a flattened-helical form. Top panel shows a side view of the shape with A = 1 and the bottom panel shows an end-on view. (d) The model predicts that increasing the ratio A leads to a decrease in the wavelength of the cell cylinder deformation, λ, and an increase in the amplitude, h. The solid line shows the results for the wide form of the flagella and the dashed line is the results for the normal form. (e) Effect of changes in the cell radius. For small values of the cell radius, a, the shape of the cell is helical. As the cell radius increases, the shape becomes more flattened. Here, values for a are given in microns.