
Figure 5.
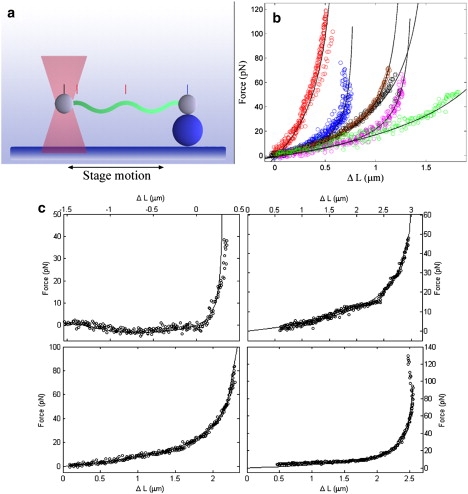
Experimental measurement of the stiffness of the cell cylinder and the periplasmic flagella. (a) Schematic of the experimental setup. Polystyrene beads are attached to two points on the cell cylinder of Triton-X treated cells or a purified flagellum. One of the beads is anchored to the coverslip via adhesion to another bead. The other bead is trapped in an optical trap. Oscillation of the microscope stage deforms the cell cylinder or flagellum. A quadrant photodiode detector is used to measure displacement of the bead in the trap. Video images are used to measure the displacement of the trapped bead with respect to fixed beads on the surface of the coverslip. (b) Six representative plots of the force vsersus displacement of the cell cylinder (see Experimental Procedure in text as well as in Supporting Material). Different colors represent data from different experiments. The black lines show the fits to the data. The parameters used to fit the data ranged from A = 21 pN μm2 to 91 pN μm2. (c) Four representative experiments for stretching purified flagella. Black circles are the experimental data. Solid lines show the fits to a model for deforming a linear elastic helix. The parameters used for these fits are A = 1.1 pN μm2 (top left), 7.7 pN μm2 (top right), 11.6 pN μm2 (bottom left), and 5.8 pN μm2 (bottom right).