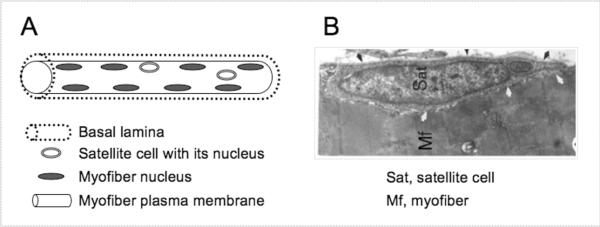
Figure 1.
A schematic (A) and EM micrograph (B) of satellite cell location. The myofiber basement and plasma membranes have been routinely detected by immunostaining with antibodies against laminin and dystrophin, respectively. In panel A, myofiber nuclei depicted at the myofiber periphery represent the state of healthy adult myofibers; immature myofibers present in regenerating muscles display centralized myofiber nuclei (not shown). In panel B, black arrows depict the basal lamina, white arrows depict apposing satellite cell and myofiber membranes; note the sarcomeric organization within the myofiber. A color version of this figure appeared in ref. 3. Panel B was first published in ref. 15.

