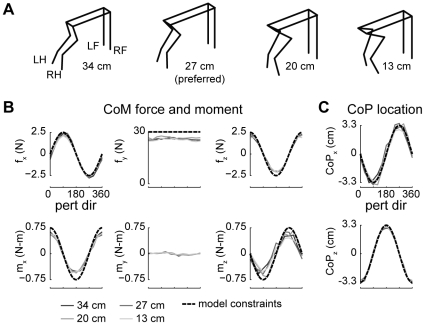
Figure 3. Kinematic and kinetic constraints used in the optimal control models.
A: Kinematics of the musculoskeletal model parameterized to cat bi at four stance distances. LH, left hindlimb; LF, left forelimb; RF, right forelimb; RH, right hindlimb. B: average forces and moments at the CoM in each perturbation direction. Solid lines indicate experimental data, dashed lines indicate task-level constraints used in models MMe, MMm, SMe, SMc. C: average displacement of the CoP in each perturbation direction. Solid lines indicate experimental data, dashed lines indicate task-level constraints used in model MPe.

