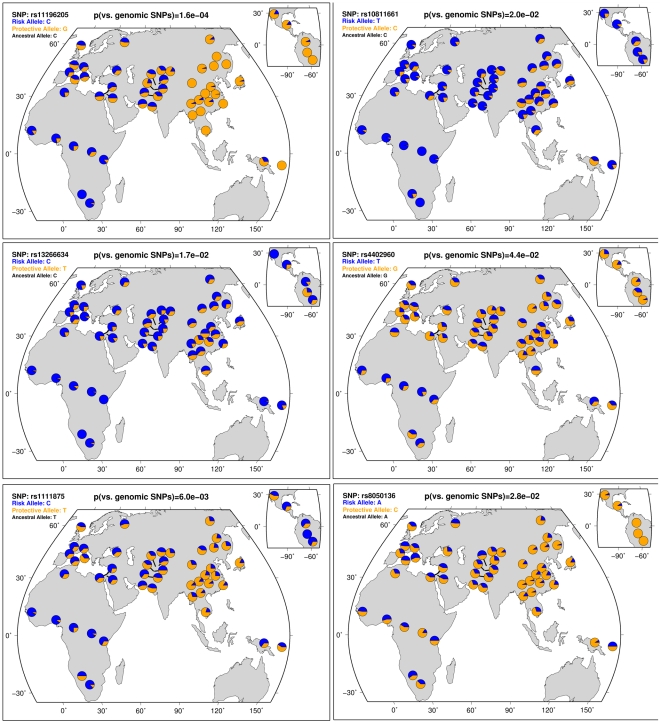
Figure 2. HGDP data show that T2D risk allele frequencies decrease from Sub-Saharan Africa through Europe to East Asia.
The frequencies of six cross-ethnic T2D risk alleles were shown as dark blue wedges across the 53 populations, calculated from 1,064 individuals in the Human Genome Diversity Panel (HGDP) [7]. All T2D risk alleles decrease frequencies gradually from Sub-Saharan Africa through Europe to East Asia. A similar pattern was observed in the remaining five T2D risk alleles in Figure S2. The central map shows the Sub-Saharan Africa region on the lower left and the East Asia region on the right. The smaller map shows Mexico and South America regions. Similar to Figure 1, p values were calculated as the percentage of genomic alleles with matched frequencies in the European populations that show both higher frequencies in the Sub-Saharan Africa regions and lower frequencies in the East Asia regions than the observed RAF. All T2D SNPs except for two in CDKAL1 show statistically significantly larger population differentiation than the frequency-matched genomic alleles (p<0.05). The (anc) in the sub-title indicates that the risk allele is the ancestral allele according to mammalian sequence data, retrieved from dbSNP.

