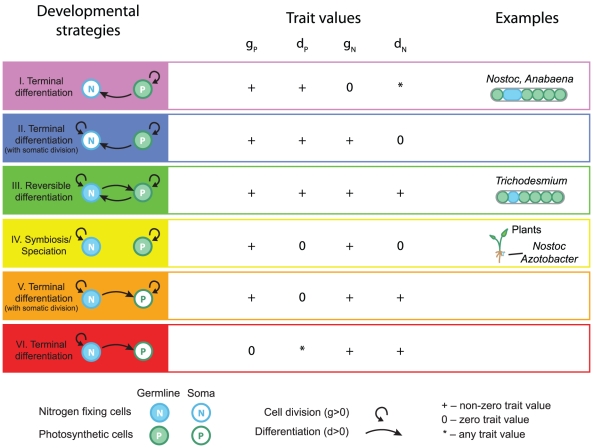
Figure 2. Possible developmental strategies.
Developmental strategies classified based on the trait averages ( ,
,  ,
,  ,
,  ). The arrows that point from one cell type to itself represent investment in growth and division (
 or
or  ) while the arrows between cell types represent differentiation (
 or
or  ). Six possible developmental strategies exist: I. terminal differentiation with photosynthetic germline and non-dividing nitrogen fixing soma (violet), II. terminal differentiation with photosynthetic germline and dividing nitrogen fixing soma (blue), III. Reversible differentiation (green), IV. symbiosis (yellow), V. terminal differentiation with nitrogen fixing germline and dividing photosynthetic soma (orange), and VI. terminal differentiation with nitrogen fixing germline and non-dividing photosynthetic soma (red). The sign (+) indicates that the trait value is greater than zero. The asterisk (*) indicates that the trait may have any value. For the purposes of classification, we considered trait values bellow the threshold of 0.05 to be effectively 0. On the right, the different developmental strategies are shown to represent observed developmental strategies in cyanobacteria. I. terminal differentiation is seen in heterocystous cyanobacteria in Nostoc and Anabaena, III. reversible differentiation is observed in the cyanobacterium Trichodesmium, and symbiosis is observed between diverse plants and the cyanobacterium Nostoc.

