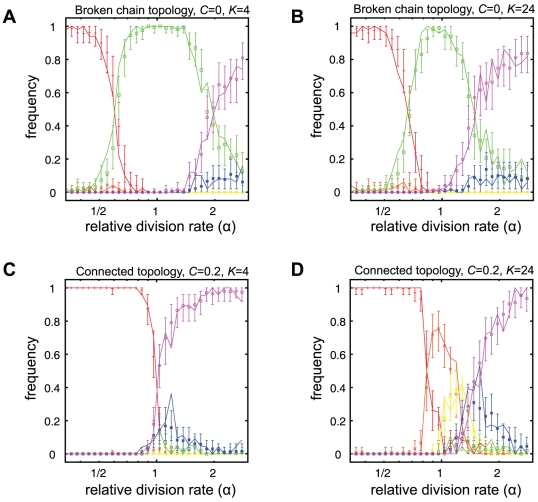
Figure 4. Frequency of evolved developmental strategies.
The solid lines show the frequency of evolution of each strategy for varying relative division rates  (50 simulations per
  value). Data points and error bars show the average and 95% confidence interval for simulations using random initial conditions. Confidence intervals were calculated using the bootstrap method on 500 simulations per
  value. Each strategy is represented by a different colour according to Fig. 2. Two different cases are shown: (A,B) broken chain topology with no differentiation costs
  , (C,D) connected topology with differentiation costs
  . Each case is shown for two different interaction ranges
  corresponding to the panels on the left, and right, respectively. Each simulation was performed with 400 cells over 10 000 generations. Relative division rates (x-axis) are in logscale.

