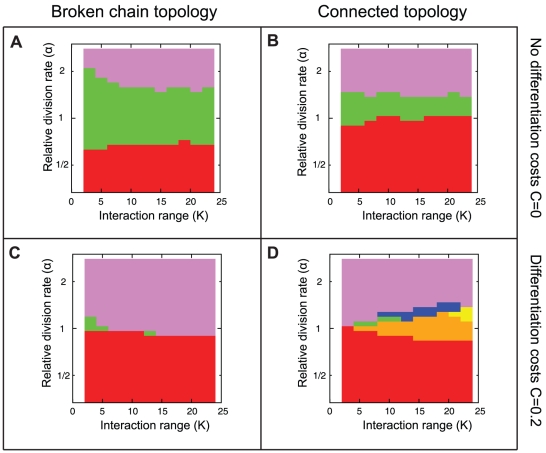
Figure 5. All possible developmental strategies evolve under some sets of conditions.
The panels show the most frequently evolved developmental strategies depending on the cell interaction range  and the relative division rate of photosynthetic cells
  . (A,C) show the results simulated in the broken chain topology with no differentiation costs
  and with differentiation costs
  , respectively. (B,D) show the results in the connected topology with the same two differentiation costs. Simulations were repeated 50 times for each parameter combination, and the population size was 400. The color represents the strategy found to evolve most frequently, with color codes as in Fig. 2. Relative division rates (y-axis) are in logscale.

