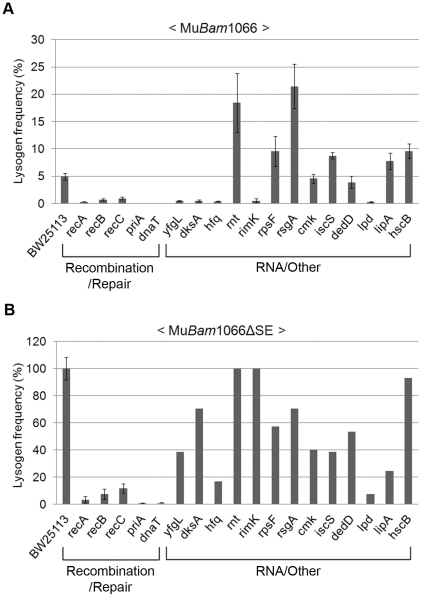
Figure 4. Mutant screen using replication-defective Mu.
Lysogenization efficiencies (calculated as CmR cells/infected cells×100) of the mutant strains infected with either (A) Mu::Cm(Bam1066) or (B) MuBam1066ΔSE::Cm. Mutant categories as in Figure 2B. Error bars indicate standard deviation from the mean of triplicate data sets obtained from three independent colonies of the same strain. In (B), data for RNA/Other mutants are from a single colony/experiment. See Methods for details.

