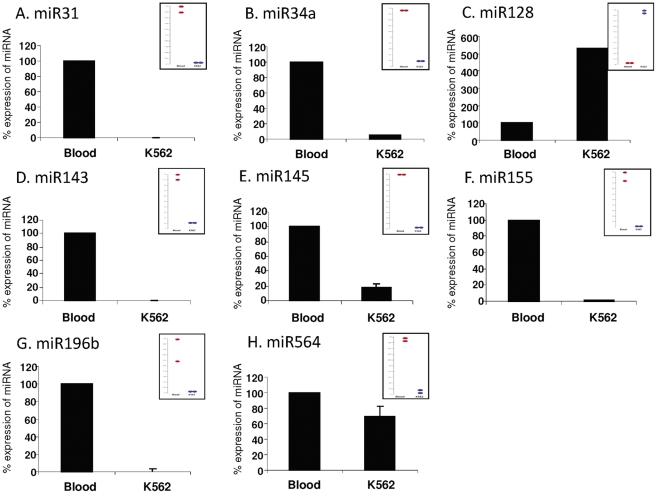
Figure 2. Real-time RT-PCR validation of microarray results, presenting changes in miRNA expression in K562 cells as compared to a pooled sample of healthy blood.
The expression of A. miR-31, B. miR-34a, D. miR-143, E. miR-145, F. miR-155, G. miR-196b and H. miR-564 was downregulated whereas the expression of C. miR-128 was upregulated in K562 cells compared to healthy blood. The histograms show percentage of miRNA expression normalized to U6-snRNA±SEM from at least 3 experiments. Insets show microarray expression results for the specified miRNAs (Blood: red circles; K562: blue circles).

