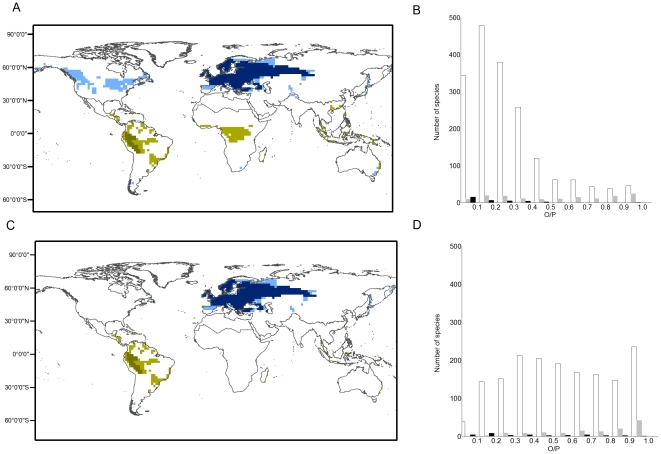
Figure 1. Observed and modeled potential distributions for two selected species: Lissotriton vulgaris (Salamandridae, Caudata) in the Palearctic region (Blue) and Chiasmocleis ventrimaculata (Microhylidae, Anura) (Green) in the Neotropic region.
Dark colors are observed distributions and light colors are potential distributions; the smaller the difference between observed and potential distributions, the greater the expected equilibrium of species with climate. (A) Global analysis, in which models calibrated for species occurring in a particular biogeographical region are allowed to project climate space globally; (C) regional analysis, in which models are not allowed to project climate space beyond the biogeographical region in which the species occurs. Frequency distribution of equilibrium values ( ) at the (B) global and (D) regional scales. White bars represent Anura, shaded represent Caudata, and black represent Gymnophiona.

