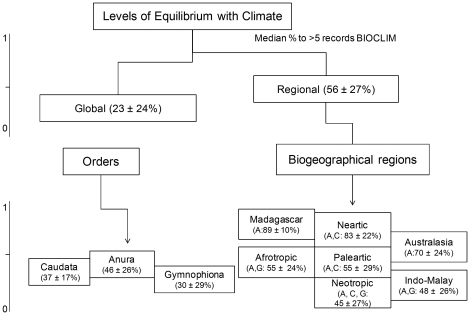
Figure 2. Diagram of climate equilibrium levels at global and regional scales, biogeographical regions and orders.
We only show Neotropical orders in the diagram because that show all orders: Caudata (C = salamanders), Anura (A = frogs and toads) and Gymnophiona (G = cecilians), however all regions were analyzed by region (see text).

