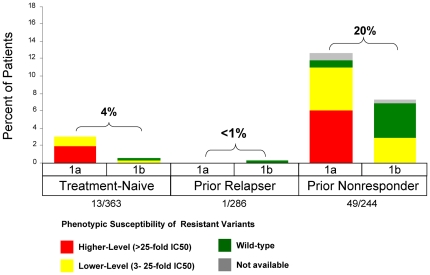
Figure 6. Frequency of Phenotypic Resistance Profiles in Patients with On-Treatment Virologic Failure during the PR Treatment Phase by Prior Response and Subtype in Phase 3 Studies (includes the T12/PR arm of ADVANCE and pooled TVR arms of REALIZE).
Higher-level resistance (red) is defined as >25-fold increase in IC50 and lower-level resistance (yellow) is defined as 3- to 25-fold increase in IC50 from wild-type.

