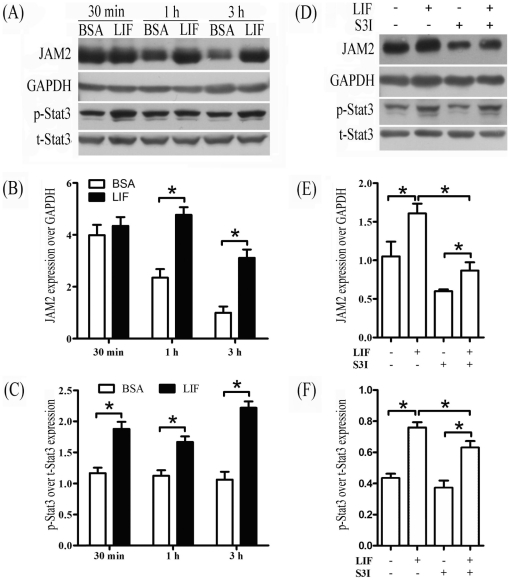
Figure 5. LIF regulation of Jam2 expression.
(A) A representative Western blot of JAM2, total Stat3 and phosphorylated Stat3 in luminal epithelium after isolated luminal epithelial sheets were treated with LIF for 30 min, 1 h and 3 h, respectively. BSA was used as control. (B) The quantitative data of JAM2 in Fig. 5A. (C) The quantitative data of phospho-Stat3 in Fig. 5A. (D) A representative Western blot of JAM2, total Stat3 and phosphorylated Stat3 after isolated luminal epithelial sheets were treated with LIF with or without S3I for 3 h. (E) The quantitative data of JAM2 in Fig. 5D. (F) The quantitative data of phospho-Stat3 in Fig. 5D.

