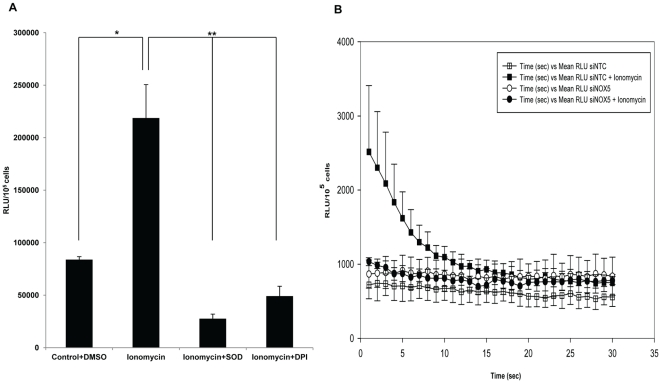
Figure 1. NOX5 regulation and activity in RCSC.
(A) Ionomycin stimulated superoxide production (NOX5) was inhibited by SOD and DPI. Harvested RCS cells suspended in Hank's complete with Ca2+ were treated with DPI or SOD, as described under Methods. The cells were then stimulated by 100 nM ionomycin or 1 µl DMSO (control). Superoxide production was assayed by chemiluminescence using the Enhanced Diogenes Assay. The area under the curve (AUC) was calculated as a measure of total superoxide production. The values were expressed as RLU/105 cells over the first 30 seconds of the chemiluminescence output. The data represent the mean ± SEM. Asterisks indicate statistical significance: *p<0.05; **p<0.01. (B) RCSC were transfected with either 40 nM non target control siRNA (siNTC) or 40 nM siRNA against NOX5 (siNOX5). After 72 h, the cells were harvested and NOX5 activity was assayed for superoxide production in siNOX5 or siNTC transfectd RCSC with or without ionomycin stimulation. Superoxide production was expressed as RLU/105 cells over the first 30 seconds of the chemiluminescence output. AUC for siNTC with ionomycin (Solid boxes) versus AUC for siNTC without ionomycin (hollow boxes) was statistically significant,*p<0.05.

