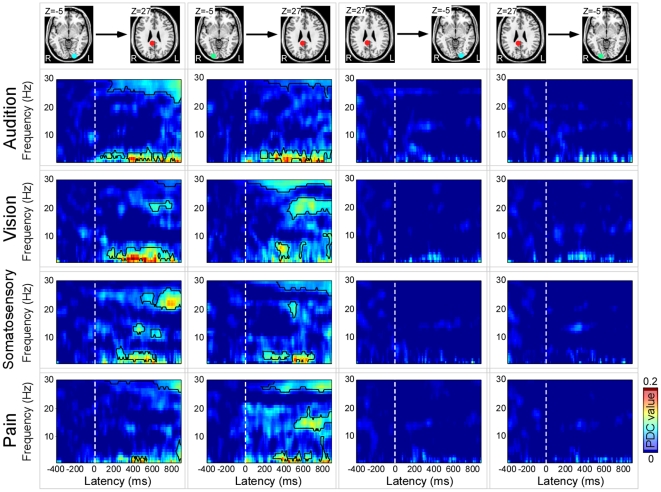
Figure 6. Time-frequency representations of time-varying PDC as a measure of causal influences between the sources of P300 and α-ERD in target conditions across all sensory modalities.
Left panel: Effective connectivity from bilateral α-ERD sources to P300 sources. Significant increases (marked in black) of effective connectivity from left α-ERD sources to P300 sources could be observed at 96–296 ms and 2–4 Hz, 344–900 ms and 1–4 Hz, and 160–900 ms and 25–30 Hz after auditory target stimuli; at 312–776 ms and 1–6 Hz, 522–784 ms and 19–23 Hz after visual target stimuli; at 216–600 ms and 2–6 Hz, 392–512 ms and 12–15 Hz, 576–680 ms and 10–13 Hz, and 648–900 ms and 20–28 Hz after somatosensory target stimuli; and at 368–552 ms and 2–3 Hz, 824–900 ms and 2–8 Hz, and 600–900 ms and 27–30 Hz after noxious target stimuli. In addition, significant increases (marked in black) of effective connectivity from right α-ERD sources to P300 sources could be observed at 136–900 ms and 2–5 Hz, 232–900 ms and 29–30 Hz after auditory target stimuli; at 344–440 ms and 3–8 Hz, 448–900 ms and 18–24 Hz, and 144–624 ms and 28–30 Hz after visual target stimuli; at 168–712 ms and 2–5 Hz, 448–512 ms and 18–23 Hz, and 336–900 ms and 27–30 Hz after somatosensory target stimuli; and at 288–706 ms and 2–4 Hz, 704–848 ms and 2–10 Hz, 480–900 ms and 12–17 Hz, and 264–900 ms and 27–30 Hz after noxious target stimuli. Right panel: Effective connectivity from P300 sources to bilateral α-ERD sources. No significant effective connectivity pattern was observed from P300 sources to bilateral α-ERD sources across all sensory modalities.

