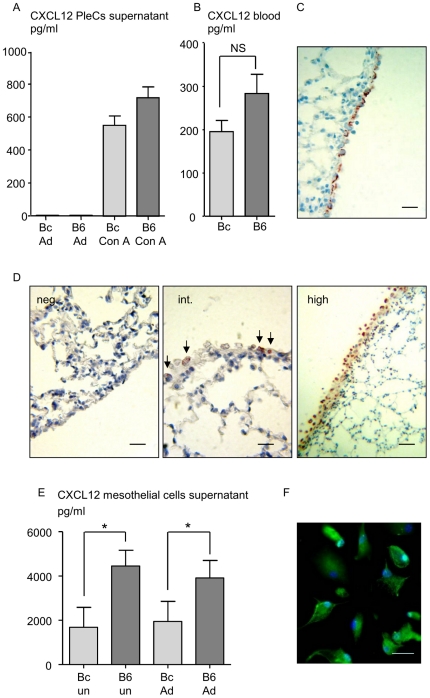
Figure 3. CXCL12 is produced by the mesothelium of C57BL/6 mice.
A. Pleural exudate cells (PleCs) were harvested 30 days post-filarial inoculation (p.i.), by PBS washing. The cells were stimulated for 72 hours with crude extract of adult (Ad) L. sigmodontis (10 µg/ml) or with 1 µg/ml of the mitogen Concanavalin A (Con A). Levels of CXCL12 were detected by ELISA (eBiosciences) in the culture supernatant. Results are expressed as mean ± SEM, 6 mice per group. B. Differential levels of CXCL12 at 30 days p.i. in the sera of BALB/c mice (Bc) and C57BL/6 mice (B6) measured by ELISA. Results are expressed as mean ± SEM, 6 mice per group; unpaired t-test, non significant (NS). C. Chromogenic immunohistochemical staining with cytokeratine 7 of paraffine-embedded visceral pleural mesothelium sections representative of naive or infected BALB/c and naive C57BL/6 tissues. Scale: bars = 20 µm. D. Chromogenic immunohistochemical staining of paraffine-embedded tissue section of C57BL/6 and BALB/c visceral pleural mesothelium: figures are representative of established scores as described in Material and Methods and in Table 1. From left to right: negative (neg.) CXCL12 staining, weak CXCL12 staining (int. for intermediate), high CXCL12 staining (high). Same results were observed with the two antibodies tested (polyclonal antibody, 1∶500, eBioscience; biotinylated clone K15C, 1∶200). Scale: bars = 20, 10, 40 µm. E. Differential levels of CXCL12 in mesothelial cell supernatants was measured by ELISA. Mesothelial pleural cells were harvested by trypsine digestion from 12 BALB/c mice and 12 C57BL/6 mice 30 days post-filarial inoculation. Once at 70% of confluence, half of the cells were stimulated for 48 hours with crude extract of adult L. sigmodontis (10 µg/ml, groups Bc Ad and B6 Ad). Unstimulated cells were also tested (Bc un and B6 un). Detail of culture conditions is provided in Material and Methods. Results are presented after subtraction of the baseline production as a barplot showing medians and range. The differences between strains were analysed by a Kruskall-Wallis test followed by a Dunn's multiple comparison test. “*” represents significant differences between the C57BL/6 mice and the BALB/c mice. F. Fluorescent immunological staining of CXCR4 on mesothelial cells culture. Scale: bars = 15 µm.

