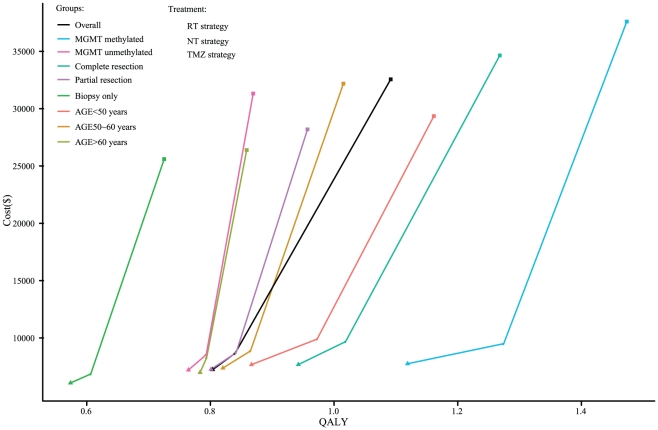
Figure 2. Analysis of the cost effectiveness of the first-line strategies for GBM in the overall cohort and the 8 subgroups.
The x-axis represents the undiscounted 5-year quality-adjusted life-years (QALYs) for each strategy, and the y-axis represents the total undiscounted 5-year costs (in US dollars). The oblique line connects the RT strategy and the most cost-effective strategies; strategies above the straight lines were dominated or extended dominated.

