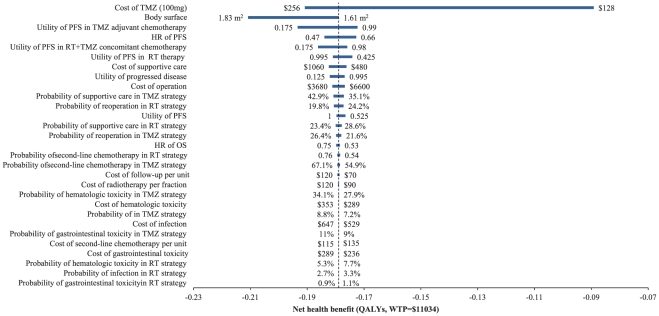
Figure 3. A tornado diagram of one-way uncertainty analyses in the overall cohort.
The graph shows the effects of the variables on net health benefit (in QALYs, with WTP = $11,034) between the RT and TMZ strategies. The width of the bars represents the range of the results when the variables are changed, as shown in Tables 1, 2, 3. The vertical dotted line represents the base-case results. The vertical line represents the base-case value for the net health benefit with WTP = $11,034. PFS: progression-free survival; OS: overall survival; HR: hazard ratio.

