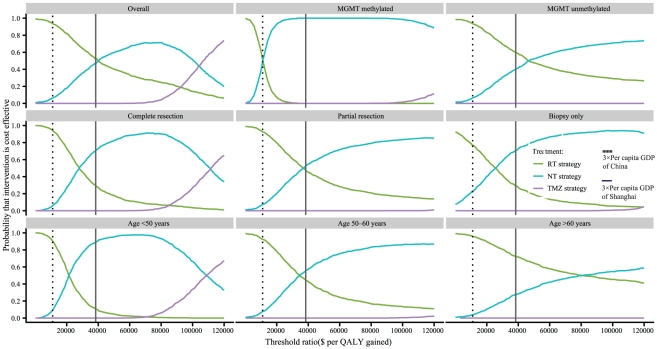
Figure 5. The cost-effectiveness acceptability curves for the three first-line strategies for GBM in the overall cohort and the 8 subgroups.
The vertical axes represent the probabilities of cost effectiveness. The horizontal axes represent the willingness-to-pay thresholds to gain 1 additional quality-adjusted life-year (QALY). The bold vertical dashed and solid lines represent the thresholds for China and Shanghai City, respectively.

