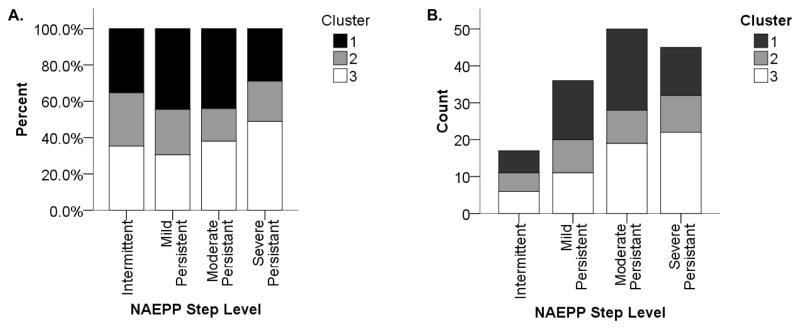
Figure 1.
Phenotypic cluster distribution according to National Asthma Education and Prevention Program (NAEPP) severity level. Each of the three clusters is made up of participants distributed across multiple NAEPP severity classifications. The left panel (A) shows a normalized distribution with percentages of each NAEPP level in each cluster. The right panel (B) shows a histogram of the same distribution.

