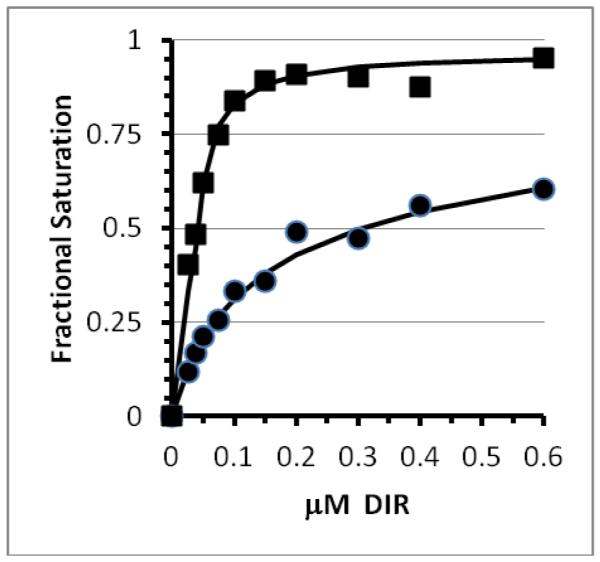
Figure 1.

Determination of equilibrium dissociation constants for soluble M8VL and M8VLSL55P. Fluorescence data for M8VL (circles) and M8VLSL55P (squares) were fit to scheme 1. Solid lines show the best fit to the data. Error bars for the individual data points are within the size of plotted points. Serial dilutions of DIR was added to 11 nM soluble M8VL or 135nM soluble M8VLSL55P protein in buffer (PBS pH 7.4 with 2mM EDTA, 0.1% w/v Pluronic F-127).
