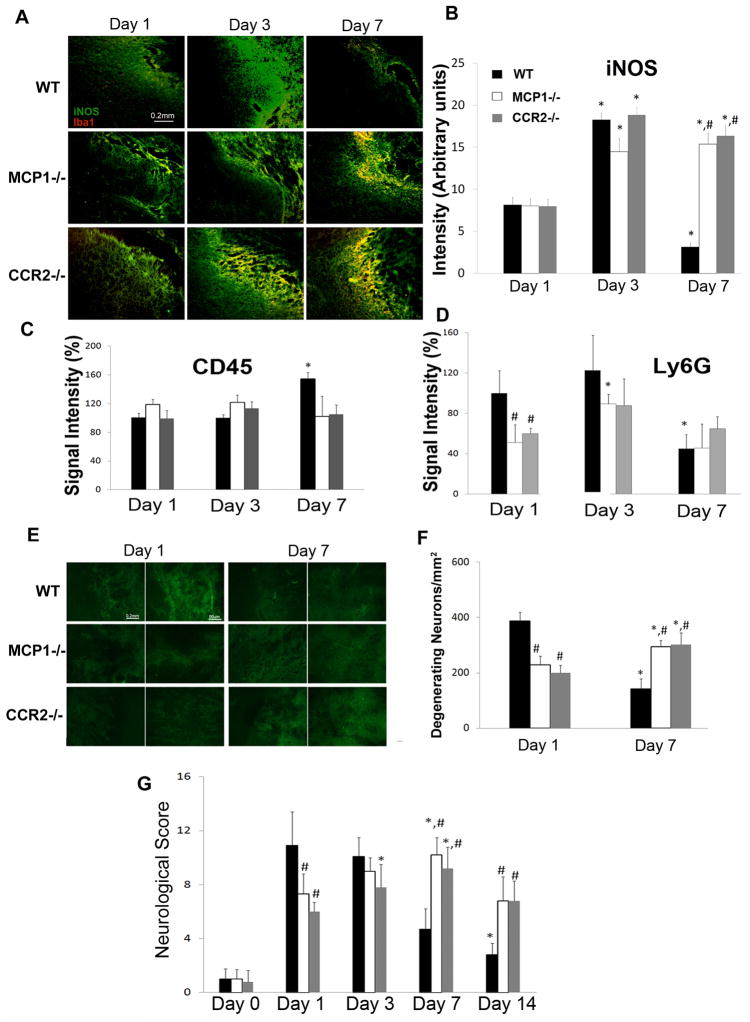
Figure 3. CCL2 and CCR2 deficiency on iNOS expression, leukocyte infiltration, neuronal death, and neurological behavior.
A. Wild-type, CCL2−/−, and CCR2−/− mice were injected with collagenase and Iba-1 (red) and iNOS (green) levels were assessed 1, 3, 7dpi. B. Quantitative data of iNOS (mean pixel intensity) levels are mean±SD (n=3). C and D. The infiltration of leukocytes and neutrophils was examined using CD45 (C) and Ly6G (D) immunostaining, respectively, at 1, 3, 7dpi. Data are mean±SD (n=4). E. Representative images of Flour Jade C staining. F. Quantification of the number of degenerating neurons on days 1 and 7dpi. Data are mean±SD (n=4). G. Neurological scores were evaluated at 1, 3, and 7dpi. Values are mean±SD. The animal numbers for wt, CCL2−/−, and CCR2−/− at 1, 3, 7dpi were 17, 8, 13; 16, 7, 6; and 9, 12, 5, respectively.

