
Table 1.
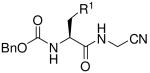
Experimental permeability in MDR1-MDCK cell monolayers and calculated ΔGtr and logS values for compounds 1-16.
 | |||||||
|---|---|---|---|---|---|---|---|
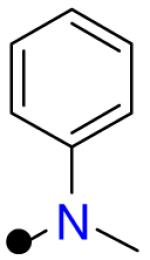
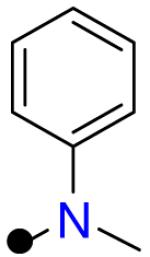
| R1 = |  |
 |
--- |  |
 |
 |
|
| Compound | 1 | 2 | 3 | 4 | 5 | ||
| Papp (nm/sec) |
A to B | 244 | 106 | 218 | 196 | 203 | |
| B to A | 296 | 167 | 310 | 318 | 364 | ||
| effluxx ratio | 1.2 | 1.6 | 1.4 | 1.6 | 1.8 | ||
| ΔGtr | 5.41 | 9.58 | 8.77 | 7.68 | 8.17 | ||
| −logS | 4.62 | 2.74 | 5.92 | 4.99 | 4.01 | ||
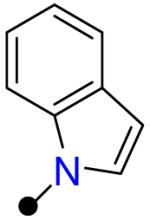
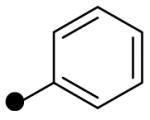
| R1 = |  |
 |
 |
 |
 |
 |
|
|---|---|---|---|---|---|---|---|
| Compound | 6 | 7 | 8 | 9 | 10 | 11 | |
| Papp (nm/sec) |
A to B | 47.5 | 117 | 145 | 103 | 5.1 | 84.1 |
| B to A | 428 | 249 | 342 | 455 | 29.4 | 257 | |
| effluxx ratio | 9.0 | 2.1 | 2.4 | 4.4 | 5.8 | 3.1 | |
| ΔGtr | 12.6 | 10.1 | 7.82 | 7.97 | 13.0 | 8.17 | |
| −logS | 5.27 | 5.96 | 5.46 | 4.97 | 4.03 | 4.04 | |

| |||||||
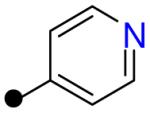
| R2 = | 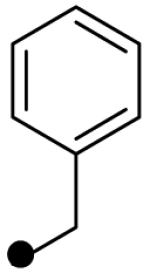 |
 |
--- |  |
 |
 |
|
|---|---|---|---|---|---|---|---|
| Compound | 12 | 13 | 14 | 15 | 16 | ||
| Papp (nm/sec) |
A to B | 232 | 239 | 246 | 177 | 43.1 | |
| B to A | 198 | 192 | 211 | 200 | 134 | ||
| effluxx ratio | 0.85 | 0.81 | 0.86 | 1.1 | 3.1 | ||
| ΔGtr | 8.1 | 8.56 | 7.65 | 10.2 | 11.0 | ||
| −logS | 3.62 | 3.60 | 3.34 | 3.00 | 2.81 | ||