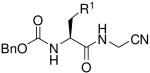
. Author manuscript; available in PMC: 2013 Apr 12.
Published in final edited form as: J Med Chem. 2012 Mar 20;55(7):3163–3169. doi: 10.1021/jm201634q

Table 2.

Low energy conformations of selected analogs, calculated as described in the text and experimental section. Predicted intramolecular hydrogen bonds are indicated with dashed lines.

graphic file with name nihms-365192-t0021.jpg
Compound R1 Low energy
conformation
2 graphic file with name nihms-365192-t0022.jpg graphic file with name nihms-365192-t0023.jpg
4 graphic file with name nihms-365192-t0024.jpg graphic file with name nihms-365192-t0025.jpg
5 graphic file with name nihms-365192-t0026.jpg graphic file with name nihms-365192-t0027.jpg
9 graphic file with name nihms-365192-t0028.jpg graphic file with name nihms-365192-t0029.jpg
11 graphic file with name nihms-365192-t0030.jpg graphic file with name nihms-365192-t0031.jpg
graphic file with name nihms-365192-t0032.jpg
14 graphic file with name nihms-365192-t0033.jpg graphic file with name nihms-365192-t0034.jpg
15 graphic file with name nihms-365192-t0035.jpg graphic file with name nihms-365192-t0036.jpg
16 graphic file with name nihms-365192-t0037.jpg graphic file with name nihms-365192-t0038.jpg