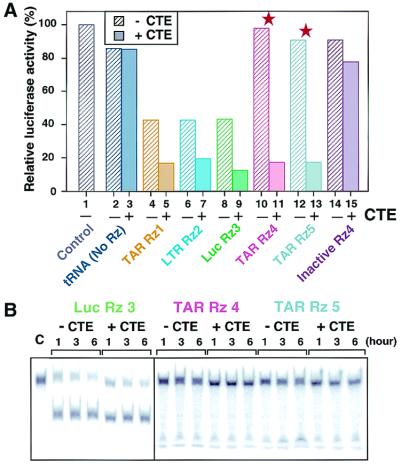
Figure 3.
Activities of the CTE-Rz. (A) Suppression of LTR-driven luciferase activity by CTE-Rz. Red stars indicate results obtained with Rz targeted to relatively inaccessible sites of the TAR. LTR-Luc HeLa cells were transiently transfected with Tat alone (lane 1) or with Tat and the indicated tRNA-based Rz constructs (13, 37). Luciferase activity as an indicator of Rz activity is reported as a percentage of the Tat-only control. The presented values are the mean of at least three data points. Because the assays used transient transfections, there is statistical variability. The error bars are within 10% when data are taken on the same day and are within 10–25% when taken on different days. However, in all cases, the CTE-Rz always had significantly greater activity than the non-CTE-Rz. (B) The cleavage activity of the CTE-Rz in vitro. Each Rz at 10 μM was incubated with a small amount of the 5′-32P-labeled substrate under enzyme-saturated conditions, in 10 mM MgCl2/50 mM Tris⋅HCl (pH 7.5) at 37°C for the indicated hours.

