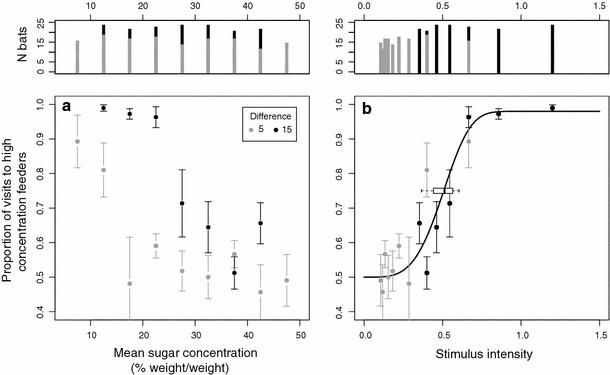
Fig. 2.

Bat visitation patterns to feeders of different concentrations. a Relative visitation rate versus mean sugar concentration. Circles represent the median proportion of visits to higher concentration feeders for the series with 5% difference (gray) and with 15% difference (black). Upper panel shows the number of bats in the tested conditions for the 5% difference (gray) and 15% difference series (black). Error bars give the median absolute deviation calculated over the respective number of bats. b Psychometric curve for concentration discrimination. Same data and symbols as in a, but with stimulus intensities on the abscissa (for intensity calculations, see “Methods”). The line represents the psychometric function fitted to the pooled data. The box gives the median (here at 0.5) and 95% confidence interval of the threshold values (ca. 75% discrimination performance) calculated for the individual bats
