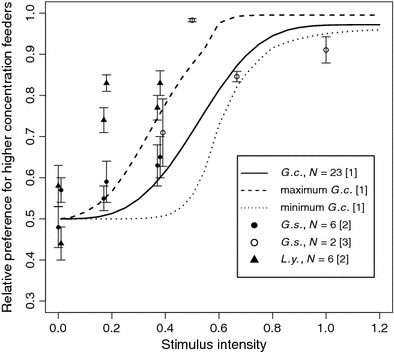
Fig. 3.

Concentration discrimination in three different glossophagine bat species. Stimulus intensities are given on the abscissa (for intensity calculations, see “Methods”). The continuous line is the psychometric function estimated from the mean threshold, slope, and lapse rate of the individuals tested in this study. The dashed lines represent the maximum (longer dashes) and minimum (shorter dashes) values from the individually fitted psychometric functions of the 23 animals tested in this study. The dashed lines give the range of the individual psychometric curves. Symbols represent mean preferences for the more concentrated feeder type, and whiskers represent one standard error. For clarity in the graph, horizontal jitter of 0.1 is added to points with the same intensity in order to prevent overlap. G.c. = Glossophaga commissarisi, G.s. = G. soricina, L.y. = Leptonycterisyerbabuenae. Sources: [1] = This study; [2] = Rodríguez-Peña et al. (2007); [3] = Roces et al. (1993)
