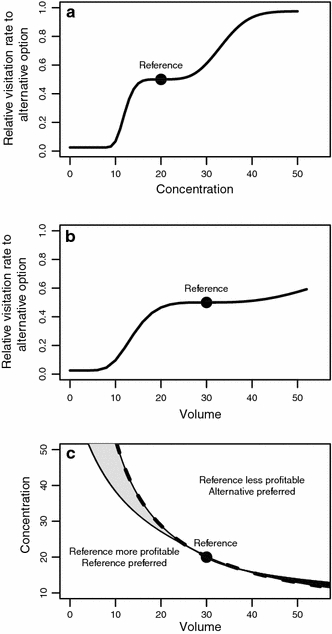
Fig. 4.

Relative preference for nectar sources in a choice between a reference option and alternatives with different volumes and concentrations. The reference option (point, all panels) has 20% concentration and 30 μL volume. a Relative visitation rates to alternative options with different concentrations and volumes equal to the reference. b Relative visitation rates to alternative options with different volumes and concentrations equal to the reference. The flat portion of the curves around the reference (a, b) is an “indifference zone” and indicates options for which bats are indifferent with respect to the reference. Preference increases more slowly for values higher than the reference (slope of curve to the right of the indifference zone) than it decreases for values lower than the reference (slope of curve to the left of the indifference zone). Curves in a and b calculated with Eq. 1. c Preference for less profitable nectar sources when both volume and concentration are changed in the alternative options. Points on the dashed line have the same energetic value (Bolten et al. 1979) as the reference. Options above the dashed line have higher and below the line lower energetic values than the reference. The continuous line marks the options for which bats are indifferent with respect to the reference, based on psychometric predictions from Eq. 1. The light gray area between the two curves contains the options that are less profitable and preferred over the reference. The dark gray area denotes the cases in which the reference is preferred even though it is less profitable than the alternative option
