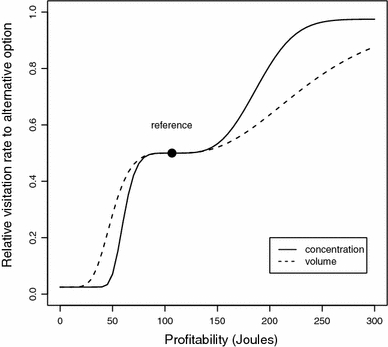
Fig. 5.

Psychometric functions for discrimination of sugar concentration (Fig. 4a) and nectar volume (Fig. 4b) recalculated in Joules. Although the two curves have roughly equal indifference zones, the concentration curve is steeper and has a lower threshold than the volume curve. Consequently, for sufficiently large changes in energetic content, bats are predicted to respond more strongly when the change is associated with a change in sugar concentration than with a change in volume. Data calculated with Eq. 1
