
Fig. 1.
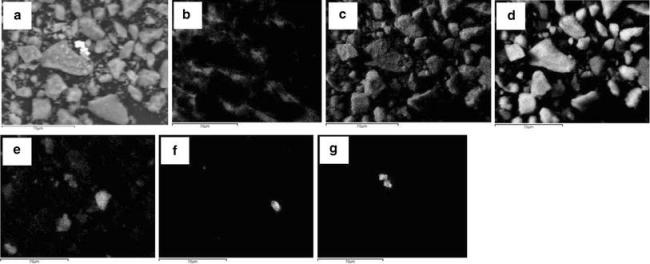
SEM images of silver NPs mixed in soil. a Sample image with the instrument detector switched to backscattering mode, followed by selected X-ray maps showing distribution of different elemental domains; b carbon, c oxygen, d silicon, e potassium, f titanium and g silver (Chappell et al., unpublished). Scale bar 70 μm