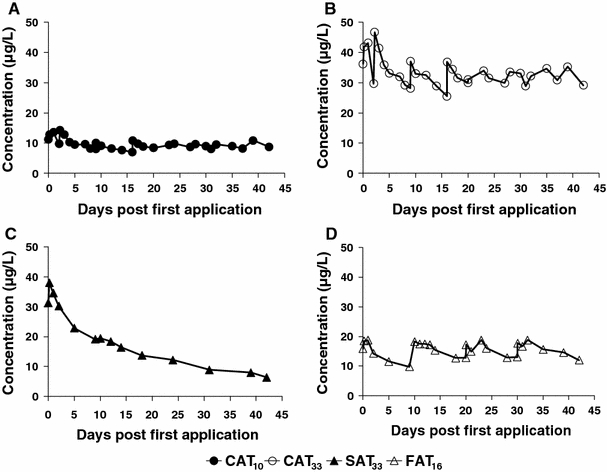
Fig. 1.

Dynamics of azoxystrobin concentrations in microcosms water during the 42 days period a continuous exposure of 10 μg/L, b continuous exposure of 33 μg/L, c single application and d four application treatments. The four applications took place on day 0, 10, 20 and 30
