Fig. 3.
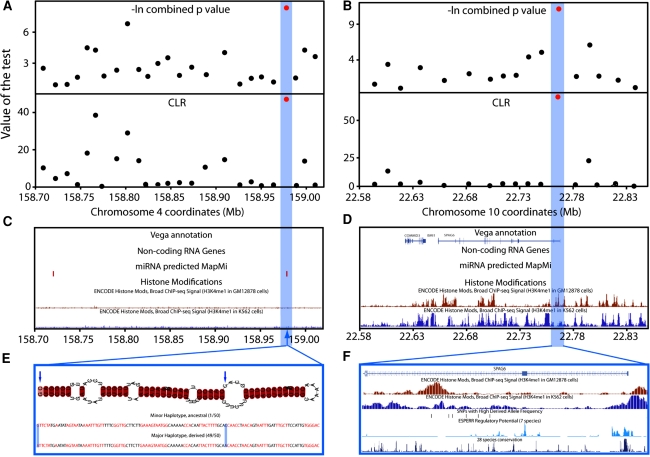
Experimental results: localization of likely selection targets in the chr4 and chr10 regions. a. -log e of combined p values from Tajima’s D and Fay and Wu’s H (top) and Nielsen et al.’s CLR (bottom) calculated from re-sequencing data in windows corresponding to two or three PCR fragments (10–20 kb). The most significant statistics are shown in red, and fall into the same window at ~158.98 Mb (blue highlight). b Corresponding analysis of the chr10:22Mb region, where the most significant signals again fall into the same window, this time at ~22.78 Mb. c, d. Protein-coding genes from the Vega annotation, non-coding RNA and miRNA genes, and relevant ENCODE chromatin modifications in the two regions. e. Predicted miRNA in the chr4:158Mb target region. Two SNPs are present, including a G > A at the end of the miRNA carried on the major haplotype (49/50 chromosomes, selected in CHB) that may influence the strand forming the mature miRNA. f. H3K4me1 chromatin modifications indicating enhancer regions in GM12878 (second) and K562 (third) cells, SNPs with high derived allele frequencies (fourth), predicted regulatory potential (fifth) and 28 species conservation (bottom). Three high-frequency derived SNPs lie within candidate enhancers in one or other of the cell lines, but high-frequency derived SNPs do not lie within regions with high predicted regulatory potential or conservation

