
Figure 6.
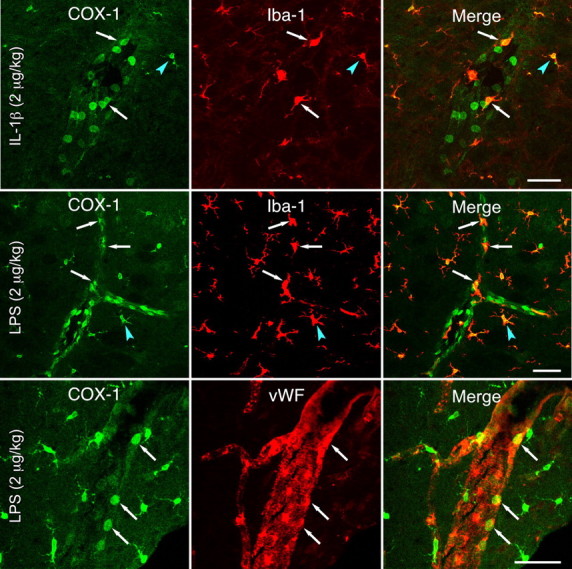
Phenotype of vascular and parenchymal COX-1-expressing cells. Sections through the medulla of IL-1β-challenged (top row) or LPS-challenged (bottom two rows) rats colabeled for COX-1 and either Iba-1, a microglial and PVC marker (top two rows), or von Willebrand factor (vWF), which marks ECs discretely (bottom). COX-1 localizes to both PVCs (arrows) and microglia (arrowheads), with areas of overlap appearing yellow in the merged images (right). COX-1-IR is also present in many round, Iba-1-negative profiles, which colocalize extensively with von Willebrand factor (bottom row). Scale bars, 50 μm.