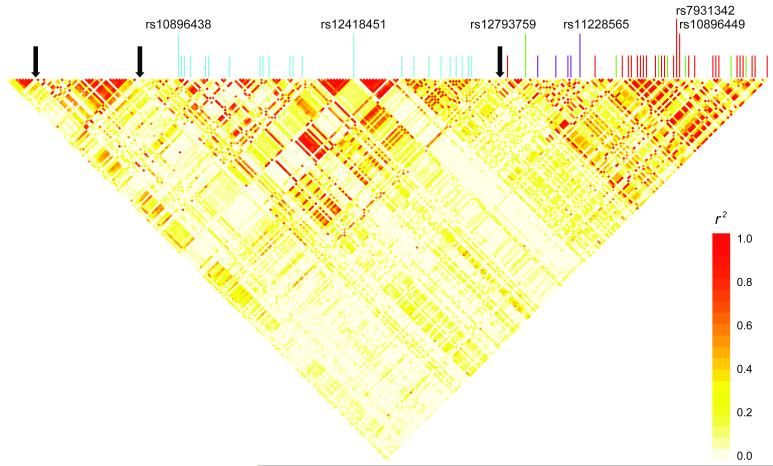
Figure 5. Linkage disequilibrium, recombination hotspots, and prostate cancer GWAS hits with surrogates (r2 ≥ 0.8) within a 122.9kb resequenced region.
Pairwise linkage disequilibrium was calculated and the heatmap was drawn using resequencing identified polymorphisms with MAF ≥ 0.05, genotype completion rate ≥ 0.4 (n=253) in 80 unrelated individuals of European ancestry. Vertical color lines indicate location of previously reported prostate cancer GWAS hits in the region to date and their surrogates identified by resequencing. Light-blue lines represent rs10896438/rs12418451 (bin2, n=23), green lines represent surrogates of rs12793759 (bin3, n=7), purple lines represent surrogates of rs11228565 (bin4, n=5), and red lines represent surrogates of rs10896449/rs7931342 (bin1, n=26). Black solid arrows indicate location of recombination hotspots

