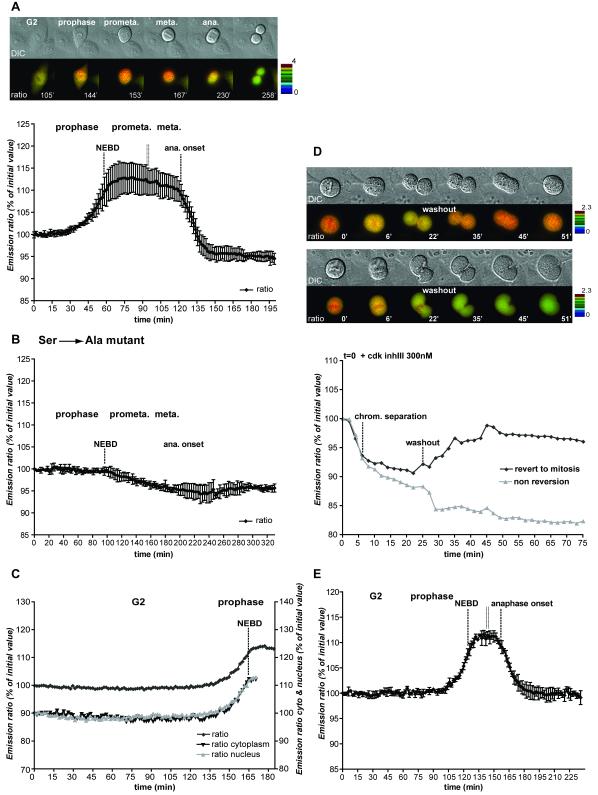
Figure 1. FRET dynamics during mitotic progression.
A. HeLa cells expressing the CyclinB1-Cdk1 activity sensor were recorded at 1 image/1’40 ”. Top: IMD representation of the FRET dynamics during mitotic progression. Bottom: Average curve of the quantification of the emission ratio over time in different cells (n=6). Quantification curves were aligned on NEBD and were eventually interrupted in prometaphase (double vertical line) to be aligned at the onset of anaphase. Note that the emission ratio is slightly lower in G1 than in G2. This seems to be due to a differential bleaching of YFP versus CFP during recording and cell rounding in some HeLa cells. Note that this decline is not seen in RPE cells (see Fig.1E). B. Average quantification curve of HeLa cells expressing the inactive CyclinB1-Cdk1 activity sensor containing the Ser126 to Ala mutation (n=5). The slight decrease in the emission ratio during mitosis is due to cell rounding up and differential bleaching of YFP versus CFP. C. Quantification of the emission ratio for the whole cell, the nucleus or the cytoplasm only in a HeLa cell progressing from G2 to mitosis. D. Dynamics of FRET signal during re-entry to mitosis. HeLa cells co-expressing the CyclinB1-Cdk1 activity sensor and a non-degradable CyclinB1L42A/R45A-mCherry were arrested in metaphase and forced to exit mitosis by adding 300 nM Cdk inhibitor III (t=0). After ~27 min the drug was extensively washed out. The top cell re-enters mitosis whereas the bottom cell does not. The quantification curves of the 2 cells are displayed. Note that in this figure the FRET level in prometaphase was set at 100%. E. Average curve of the quantification of the emission ratio during mitosis in RPE cells (n=5) expressing the CyclinB1-Cdk1 activity sensor. Curves were aligned on NEBD and the onset of anaphase as in A.

