
Figure 1.
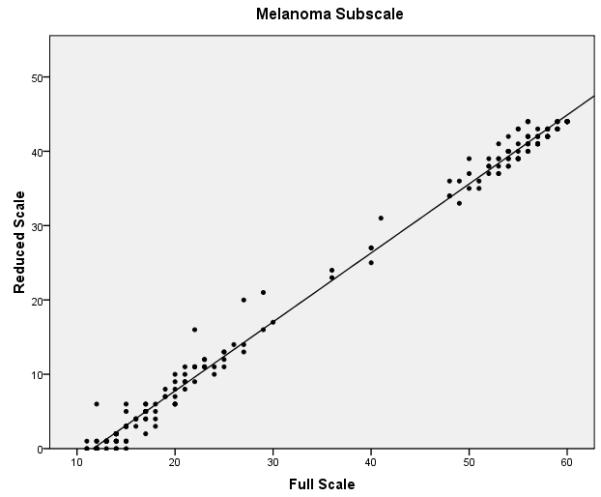
Scatter plots of full vs. reduced FACT-Melanoma scores with linear predictions for the (a) melanoma subscale, (b) melanoma surgical subscale, (c) combined melanoma module, and (d) total FACT-Melanoma.
Official websites use .gov
A
.gov website belongs to an official
government organization in the United States.
Secure .gov websites use HTTPS
A lock (
) or https:// means you've safely
connected to the .gov website. Share sensitive
information only on official, secure websites.
Scatter plots of full vs. reduced FACT-Melanoma scores with linear predictions for the (a) melanoma subscale, (b) melanoma surgical subscale, (c) combined melanoma module, and (d) total FACT-Melanoma.