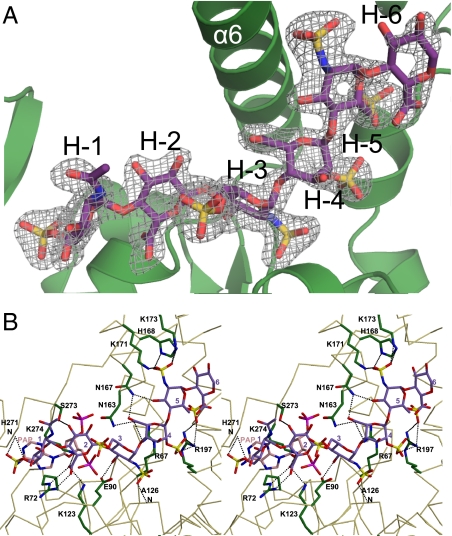
Fig. 2.
Heptasaccharide substrate binding to 3-OST-1. (A) 3-OST-1 secondary structural elements shown as a ribbon diagram (green), with the bound heptasaccharide substrate drawn in stick in purple. Simulated annealing Fo–Fc omit electron density map (gray) contoured at 2σ. (B) Stereo diagram of the protein–substrate interactions. The Cα backbone of 3-OST-1 is traced in tan. Side chains involved in substrate (purple) binding interactions are shown in green. Putative hydrogen bonding interactions are shown as dashed lines. PAP is drawn in pink. Stereo diagram was generated using MOLSCRIPT (19).

