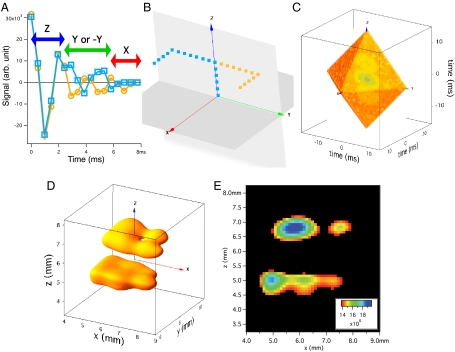
Fig. 2.
Figure showing the mapping of acquired data onto k space and the resulting image. (A) Plot showing real data acquired (from the dry bovine bone sample) in the first 17 windows for two different trajectories in k space. Starting at k = (0,0,0), both the yellow-circle and blue-square points take five steps forward along the positive kz direction (Nz = 5). Next the yellow circles (blue squares) move seven steps forward (backward) along the positive ky direction (Ny = 7). Finally, both the yellow circles and blue squares step forward along the positive kx direction (Nx = 19), for a total of 32 points. (B) A 3D plot of these two trajectories in k space. See Movie S1 to see how this mapping takes place. (C) Three-dimensional octahedron of k-space points measured with our imaging scheme (plotting the magnitude of the complex points in the time domain). The imaging time was just under 47 h. (D) Isosurface rendering of the 3D image of 31P in two dry bovine bone blocks separated by a 1.1-mm gap obtained by Fourier transformation of Fig. 2C. The spatial resolution is 0.428 × 0.428 × 0.353 mm3. Note the thru-hole in the top block, which was drilled using a 0.343-mm-diameter drill bit. The sample dimensions are 4.9 × 2.6 × 1.4 mm3 (bottom bone) and 4.2 × 2.4 × 1.4 mm3 (top bone). The isosurface value was chosen to show the presence of the thru-hole and is 65% of the maximum signal value. See Movie S2 for a better view of this 3D isosurface. (E) A 2D slice of the 3D data (zero-filled by a factor of four) with thickness of 0.107 mm. The cutoff for the minimum of the color scale is the isosurface value used in Fig. 2D to clearly show the thru-hole in the top bone and two partial holes in the bottom bone, made by the same 0.343-mm-diameter drill bit.

