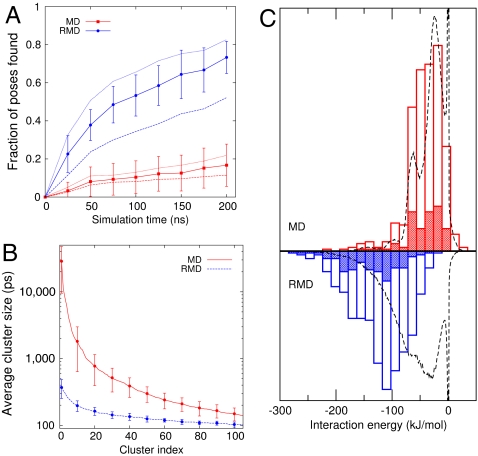
Fig. 3.
Comparison of the exploration speed, cluster sizes, and interaction energies for the MD and RMD trajectories. (A) The fraction of the reference (EADock) poses found as a function of simulation time. A pose is found if the rmsd distance between it and the instantaneous position of the ligand drops to less than 2.5 Å. The average over all the RMD or MD runs (solid lines) is shown together with the standard deviation between runs. The averages obtained using cutoffs of 2 Å (dashed lines) and 3 Å (dotted lines) are also shown. Here, RMD consistently explores space more quickly than MD. (B and C ) The results from the clustering calculations. B shows the sizes of the top 100 clusters averaged over the 10 MD and 10 RMD simulations together with the standard deviations calculated for every 10th cluster. The clustering was done using a fixed rmsd cutoff of 1 Å. Hence, more diffuse clusters have fewer members. In reporting this data, we have multiplied the number of trajectory frames in each cluster by the time interval between the frames (10 ps) to get a residence time for each cluster. This figure clearly demonstrates that RMD is spending much less time in each pose, allowing a more efficient exploration of the configurational space. C shows a histogram of the single point protein-ligand interaction energy for the central frame in the top 10 (shaded area) and top 50 (unshaded areas) clusters from each of our RMD and MD simulations. Also shown is the histogram (dashed line) calculated from all the frames in the trajectory. Here, the results demonstrate that MD fails to find the low interaction energy poses that are found during the RMD simulations.

