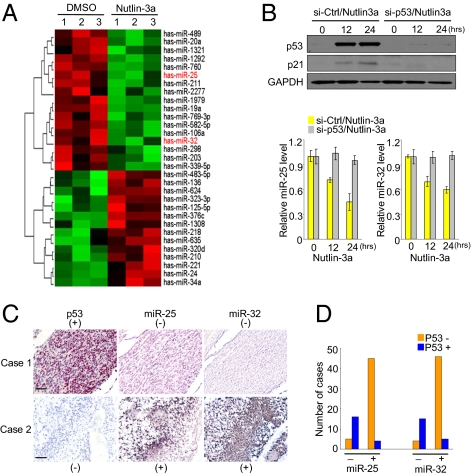
Fig. 1.
Identification of p53-regulated miRNAs in human GBM. (A) Overview of NanoString assay with U87 cells treated with 10 μM Nutlin-3a overnight (biological triplicate) and DMSO (biological triplicate). miRNAs sorted by P value of the univariate test (BRB tools) at the nominal 0.05 level of the univariate. (B) p53 and p21 protein levels (Upper) and miR-25 and -32 expression levels (Lower) in response to Nutlin-3a treatment (10 μM) of p53-silenced (si-p53) and control U87 cells (si-Ctrl). Data are presented as mean ± SD. We performed three biological experiments in triplicate. (C) Representative cases from 70 glioblastoma specimens in tissue microarrays were analyzed by immunohistochemical staining (p53; red) and ISH (miR-25 and -32; blue). (Scale bar: 40 μm.) (D) Graphs summarizing χ2 analysis of immunohistochemical and ISH staining results.

